I've been wanting to do this for quite some time now, and it's finally time for the Year in Review of.. my own site!
It's understandable that my visitors want some insight in what's been going on behind the scenes as well and I'd be glad to share some interesting statistics with you. My website now has an average of 2300 visitors per week!
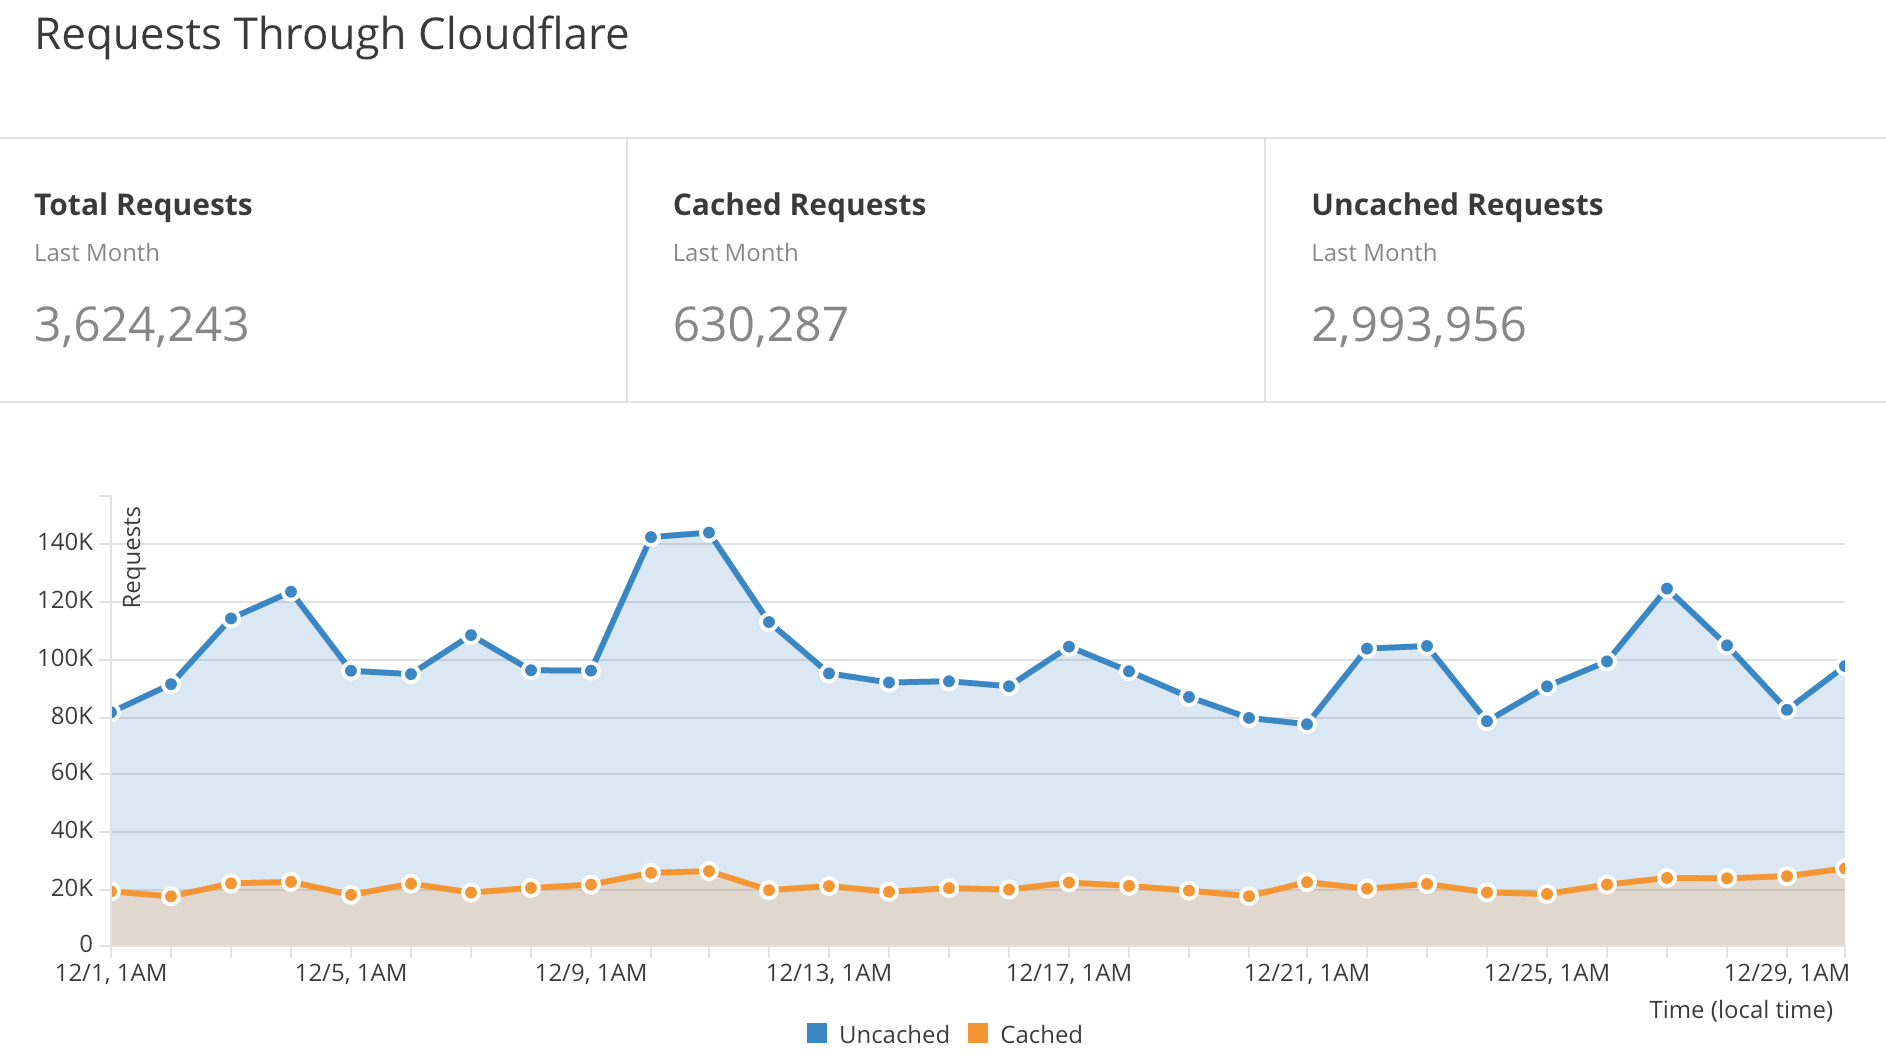
According to Cloudflare, I've been getting millions of requests every month! Unfortunately I cannot look back further than one month, but here's how it went down in December:
 That's quite a lot!
 Visitors
I use the open source analytics software Piwik to keep track of my visitors, and what people generally do on my website. For example, I can see where people end up getting page not found errors, so I can correct those errors and make sure everyone has a pleasant experience navigating through my site! Here's my visitor graph for throughout the year – Every dot in the graph stands for one week. During April, my analytics software had some outages, so no visits were tracked during then.
The red line means visitors, and the blue one stands for unique visits.
There was quite a spike in the amount of visitors during May. I am guessing that this is due to Holidays beginning and finals having finished for many high school pupils, causing them to have more free time to spend.
For site visitors, Google Chrome was the most popular browser, with about 60% of all visitors using it.
Additionally, it seems like Microsoft Edge and mobile browsers have grown immensely, with Microsoft edge being used over 4 times more than last year.
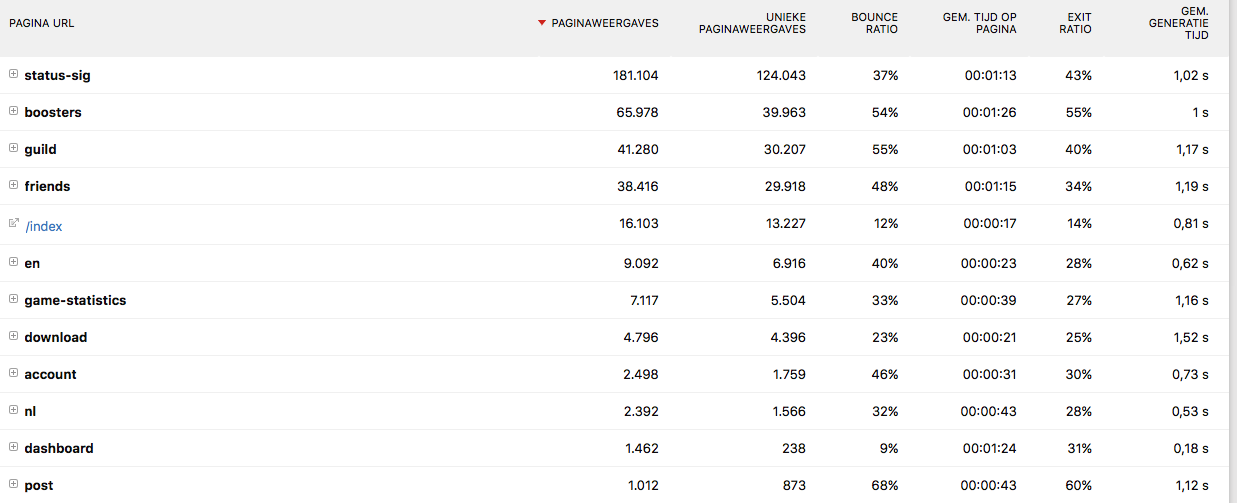
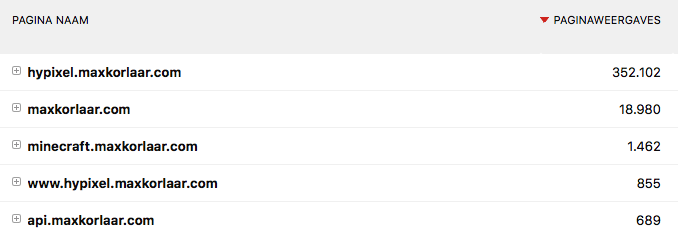
The subdomain hypixel.maxkorlaar.com is by far the most popular area of my website, getting many thousands of visits. The most popular parts of that site are the dynamic signatures, booster overviews and friends lists.

The comparison of domains is clearly made in the following table:
